
Counting the Costs
For the SMART Grant, the Road Commission for Oakland County (RCOC) has requested that a crash analysis be conducted for all the roads in the whole Oakland County area, which is approximately 910 square miles. Oakland County is a county in the state of Michigan and it’s a principal county of the Detroit metropolitan area. Oakland County is composed of 62 cities, villages, and townships. Its county seat is Pontiac, and its largest city is Troy. RCOC maintains the largest county road system in Michigan and is responsible for the 2,700-plus miles of county roads including roads in townships. Since 1978, safety considerations have been the most-heavily weighted factor in road-improvement project selection for RCOC. RCOC, cities and villages all agreed to make “safety” the top priority in federal STP (Surface Transportation Program) project rating system & 2nd highest for TEDF (Transportation Economic Development Fund) rating.
A crash analysis has been conducted for a ten-year period (January 1, 2013 to December 31, 2022). One set of crash data was obtained from RCOC’s preferred database, the Transportation Improvement Association (TIA) Traffic Crash Analysis Tool (TCAT), and is provided in Tables 1-5 and Figures 1-3. Another set of crash data was obtained from a different database, the Michigan Traffic Crash Facts (MTCF), and is provided in Tables 6-11 and Figures 4-6. The reason for obtaining crash data from MTCF was to compare and validate it with the crash data from TIA in order to make sure that it’s in the same range.

Data Set 1 - TIA Crash Data

From 2013-2022, there have been a total of 4,369 KA crashes (crashes with fatal or serious injury), with the year 2014 having the highest number (496) and the year 2020 having the lowest number (388). As shown in Table 1, Oakland County had the highest number of fatal crashes in 2016, but had fewer incapacitating injury (A) crashes than in the year 2014.
Table 3
Table 4

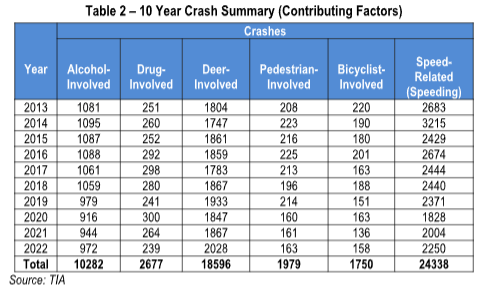
From 2013-2022, there have been a
total of 167 fatal pedestrian-involved crashes, with the years 2016, 2019, and 2021 having the highest number (21) and the year 2018 having the lowest number (7). As shown in Table 2, Oakland County had the highest number of pedestrian-involved crashes (225) in 2016, and of those crashes, approximately 9% were fatal.
Figure 5

From 2013-2022, there have been a
total of 19 fatal bicyclist-involved crashes, with the year 2015 having the highest number (4) and the year 2013 having the lowest number (0). The fact that Oakland County had zero fatal bicyclist-involved crashes in 2013 is unexpected because 2013 was the year that Oakland County had the highest number of bicyclist-involved crashes (220) as shown in Table 2.


Table 9
Table 10
Table 11


From 2013-2022, there have been a total of 4,360 KA crashes (crashes with fatal or serious injury), with the year 2014 having the highest number (490) and the year 2020 having the lowest number (387). As shown in Table 6, Oakland County had the highest number of fatal crashes in 2016, but had fewer incapacitating injury (A) crashes than in the year 2014.
From 2013-2022, there have been
a total of 167 fatal pedestrian-involved crashes, with the years 2016, 2019, and 2021 having the highest number (21) and the year 2018 having the lowest number (7). As shown in Table 7, Oakland County had the highest number of pedestrian-involved crashes (224) in 2016, and of those crashes, approximately 9% were fatal.
From 2013-2022, there have been
a total of 19 fatal bicyclist-involved crashes, with the year 2015 having the highest number (4) and the year 2013 having the lowest number (0). The fact that Oakland County had zero fatal bicyclist-involved crashes in 2013 is unexpected because 2013 was the year that Oakland County had the highest number of bicyclist-involved crashes (219) as shown in Table 7.
Data Set 2 - MTCF Crash Data


Over the ten-year period (January 1, 2013 – December 31, 2022) in Oakland County, MI, there have been:
o A total of 375,485 motor vehicle crashes.
o Approximately 638 fatal motor vehicle crashes.
o A total of 4,369 K & A crashes. (Crashes with fatal or serious injury)
o A total of 167 fatal pedestrian-involved crashes.
o A total of 19 fatal bicyclist-involved crashes.